Dr. Craig Wallace, Lead Climatologist.
We routinely evaluate the latest, leading, global climate data sets, both to generate information for our clients and, if time, for our own general scientific interest.
In so far as global observed temperature records go, one of the (if the) most established and well-respected records is the Climatic Research Unit & UK Meteorological Office HadCRUT dataset, current version [July 2023] HadCRUT5 [1].
This is a blended data set of monthly-mean ocean surface temperatures and land surface air temperatures (~2m) and it has been a mainstay of scientific climate analysis for decades and a key element in the United Nations Intergovernmental Panel on Climate Change’s (UN-IPCC) assessment reports evaluating anthropogenic influence on the climate system: HadCRUT, in its various incarnations over the years, has been categorical in the detection and attribution of anthropogenic warming.
This month we implemented new code to analyse HadCRUT5, together with other data, part of which involved re-calibrating HadCRUT5 anomalies to a pre-industrial benchmark, as opposed to their standard provided 1961-1990 climatology.
Re-adjusting these data to a pre-industrial average is now a critical requirement, since it is against the pre-industrial climate state that the United Nations has set global warming limits – such as the 1.5 and 2.0°C limits associated with the well-known Paris Agreement [2]. Therefore this is what we did.
In our calculations, we follow the UN-IPCC adoption of defining the pre-industrial period as the 51 years between 1850-1900 [3] [4] [5], a period commensurate with near-global observations and a low (but not zero) level of human greenhouse gas emissions.
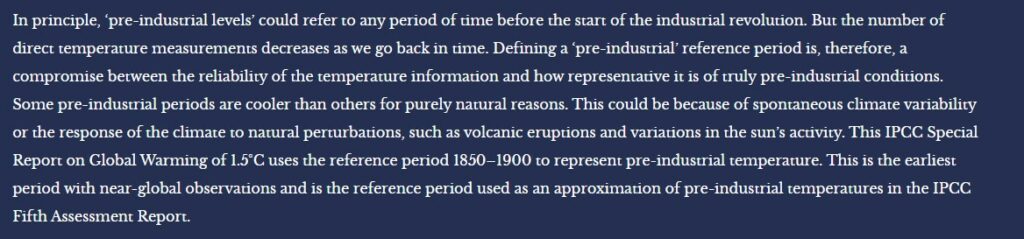
Other pre-industrial period definitions have been discussed [6] [7] on the basis that some anthropogenic influence on the global climate system is likely to have been present even by 1850, and that volcanic feedback existed in the 1880s – and that the balance between those two opposite forcings is uncertain. We will return to this point below, however, in-line with the bulk of scientific assessments, we predominantly use the 1850-1900 period given the noted rationalisation above.
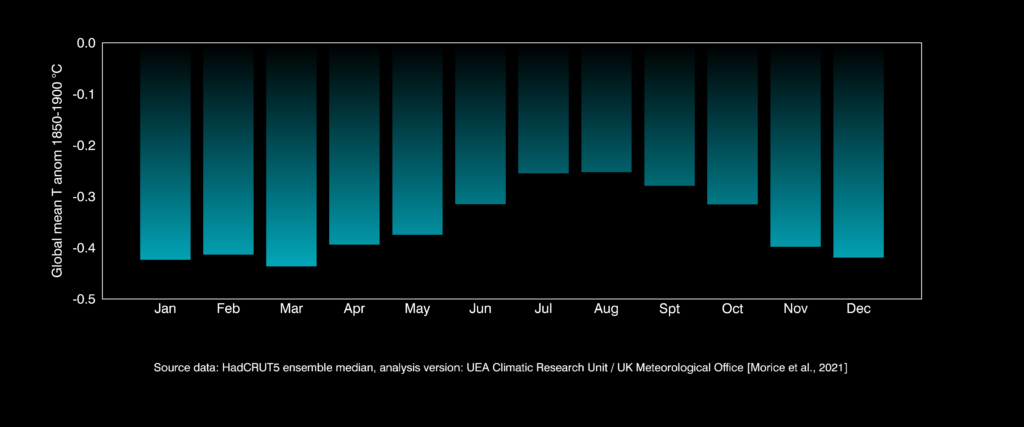
To proceed with our re-adjustments, we compose a vector, x, of 12 1850-1900 average anomalies, in their 1961-1990 form, for each calendar month, January to December. Each of the 12 values is the mean of the 51 Januarys (or Februarys, Marchs, Mays etc) within the 1850-1900 time slice. The resulting values are shown below:
Thereafter, for each respective calendar month, i, January … December, we add absolute |x|i to all Januarys, Februarys … December in the raw, 1961-1990 anomaly data, therefor re-expressing the 1961-1990 anomaly values to 1850-1900. To use January as an example, the 1961-1900 anomaly series looks like this:
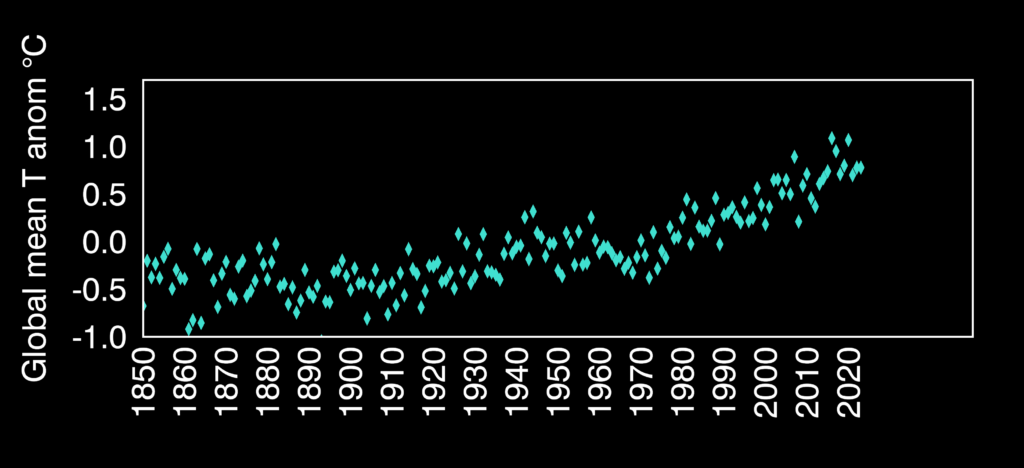
The 1850-1900 mean of the 1961-1990 January anomalies is -0.4238. By adding absolute(-0.4238) to the series, they become re-expressed with reference to (wrt) 1850-1900 (orange series in the below plot). The mean of the 1850-1900 anomalies is, accordingly, zero:
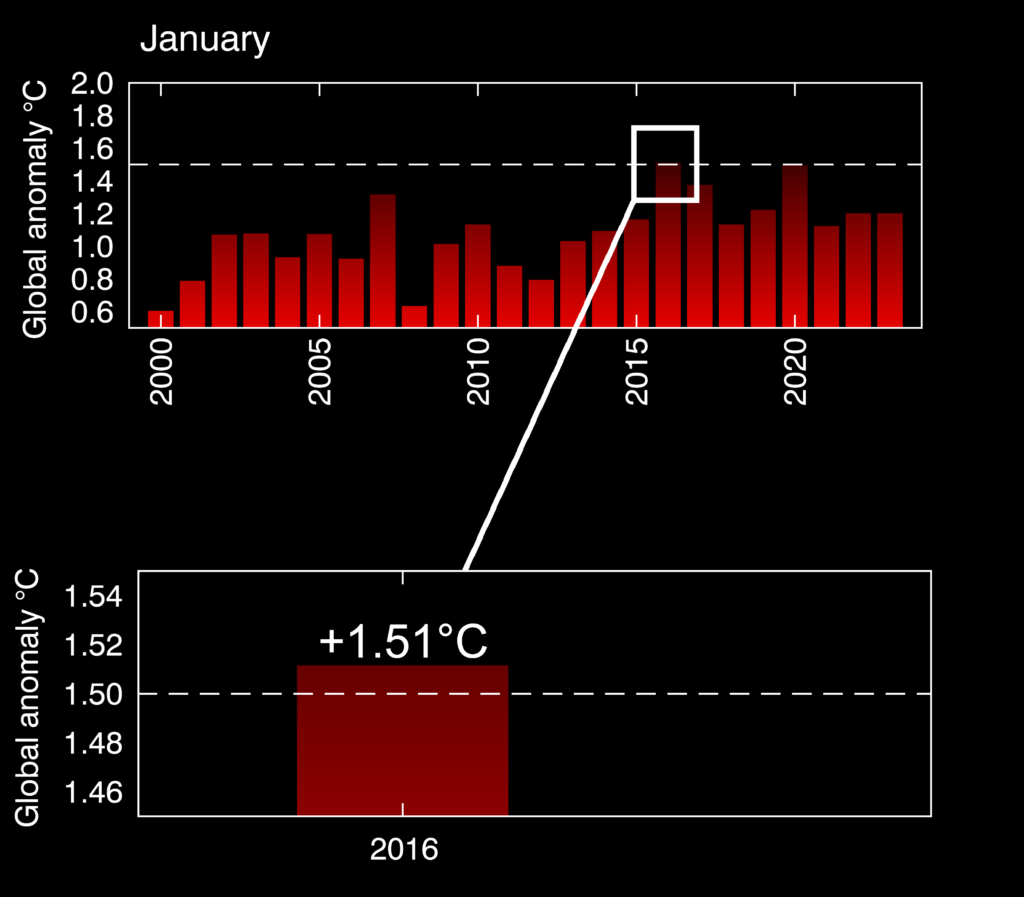
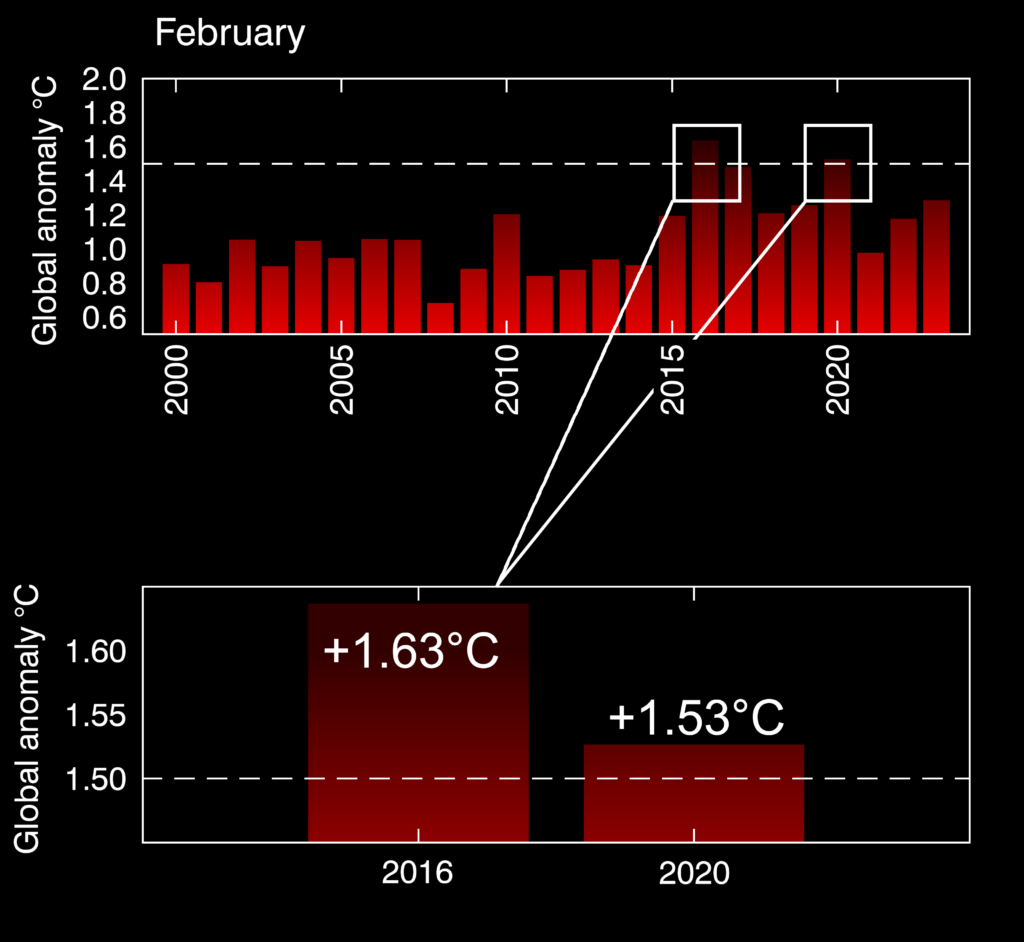
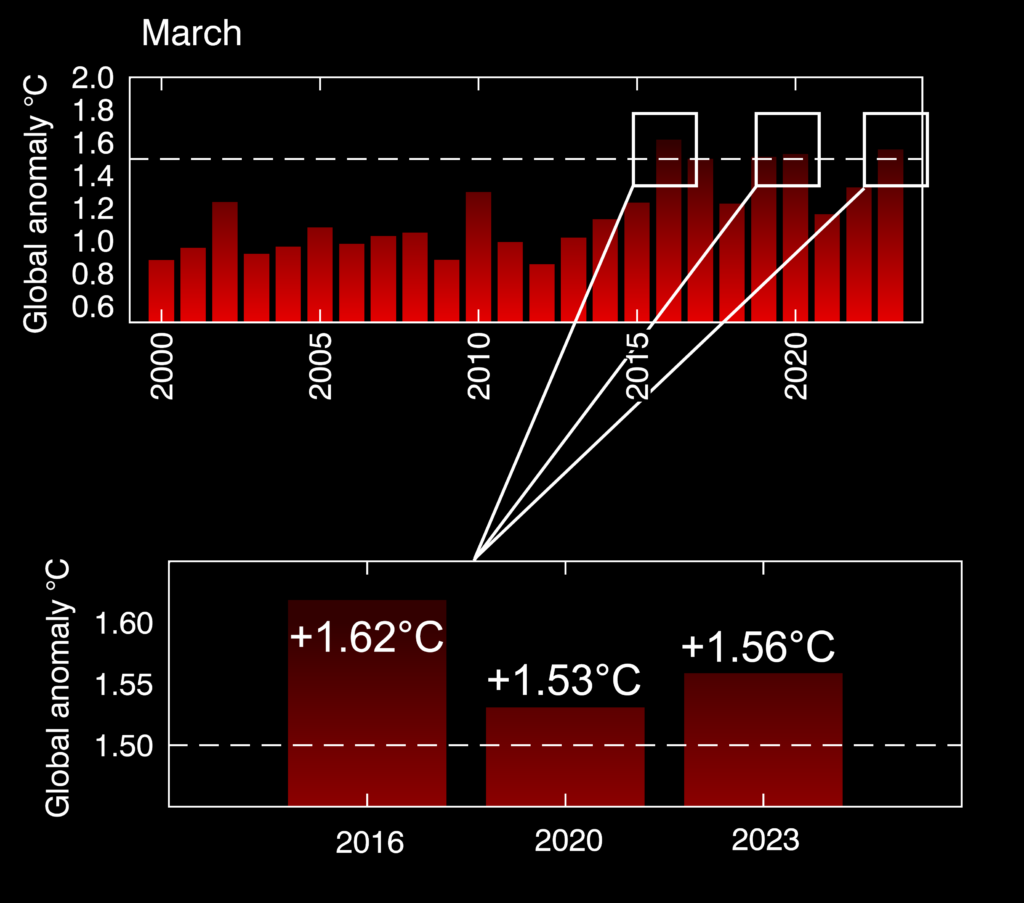
Having applied the transform for the remaining 11 moths, we can then sweep the monthly series for anomalies >1.5°C. In doing so, we find none before 2015, and a total of 6 months since 2016, the most recent being March 2023 (at the time of this analysis HadCRUT5 has not been updated beyond March 2023, due to the operational delay of collecting, cleaning and calculating the component data that comprises the global mean).
The six months with warming in excess of 1.5°C are:
January 2016: +1.51°C
February 2016: +1.63°C
March 2016: +1.62°C
February 2020: +1.53°C
March 2020: +1.53°C
March 2023 +1.56°C.
We can examine these breaches by plotting the time series of the HadCRUT5 values (wrt 1850-1990) for the relevant months of January, February and March (nb. only values > year 2000 are plotted, since no breaches occur before 2016 ):
Given the scientific consensus that limiting global warming to 1.5°C is required to avoid dangerous levels of climate change (compared to higher levels, say, 2.0°C) [5] [8] [9], we should be extremely alarmed at these findings — the first evidence that Earth has, in fact, heated beyond the threshold for periods longer than a few days [10].
To conservatively assess these findings in the context of the UN-FCCC, however, we must point out that the UN-FCCC has, in it’s formation, been clear that warming limits, thresholds etc, refer to – and only to – the anthropogenic component of heating [11] [12]
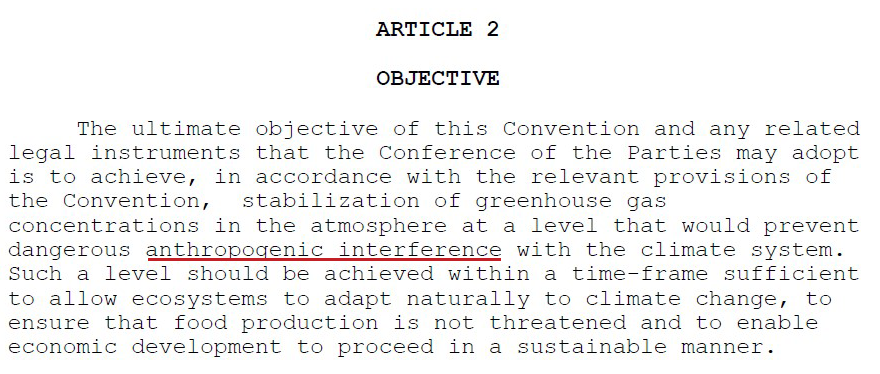
This nuanced definition does not detract from the importance of the above findings but, rather, points to the fact that a formal, technical, breach of the 1.5°C limit (in UN-FCC parlance) would require an extended period, at least say two decades, in which the mean anomaly benchmarked to 1850-1900 is >1.5°C. This requirement is to ensure that the warming signal is indeed anthropogenic: to do this we must sample a sufficiently long period within which natural forcing agents effectively cancel each other out. The principal process in this consideration, is the La Niña & El Niño phenomenon, modifying global temperatures a few tenths of a °C either way. Indeed, the 2016 breaches noted above co-incide with an exceptionally strong El Niño, suggesting the human-driven warming was <1.5°C.
However, more worryingly, the most recent breach, March 2023, occurred during the tail-end of an extended La Niña phase which imparted a cooling upon the human-driven warming. This would suggest not only that March 2023’s warming was human-driven but, also, that the human-caused heating was likely in excess of the observed 1.56°C.
To establish confidence in the evident 1.5°C breaches revealed in HadCRUT5 we can refer to an alternative dataset – GISTEMP4 – produced by NASA’s Goddard Institute of Space Sciences, and another ‘de-facto’ data set used by the UN-IPCC for climate monitoring [13] [14]. Aside from using different assemblage techniques, these data are useful since they force us to use an alternative preindustrial period: GISTEMP4 records commence in 1880, rather than 1850. Therefore we repeat the transformation as described above, but using an 1880-1900 mean for each month and apply this to the GISTEMP4 anomalies (expressed in their raw form to 1951-1980). In doing so, the following months are identified as having breached 1.5°C – all of which cross validate as HadCRUT5 breaches:
February 2016: +1.64°C
March 2016: +1.59°C
February 2020: +1.52°C
The three absent months, compared to HadCRUT5, are January 2016, February 2020 and, of course March 2023 (+1.44°C).
One final interesting exercise is to re-define the pre-industrial period used in our initial HadCRUT5 transform from 1850-1900 to 1880-1900 so as to match NASA-GISTMEP4 and then re-scan HadCRUT5 for 1.5°C breaches. We find an additional breach, January 2020, and that three of the prior-noted breaches (January 2016; February 2016 and February 2020) are stronger when using this benchmark:
January 2016: +1.56°C
February 2016: +1.66°C
March 2016: +1.62°C
January 2020: +1.53°C
February 2020: +1.54°C
March 2020: +1.53°C
March 2023 +1.56°C
It is likely this enhancement of the breach magnitudes relates to the 1883 global cooling imparted by the Krakatoa eruption (e.g. [15] and others) – thus reducing the 1880-1900 benchmark temperatures, compared to a longer period. On balance this lends weight to the original selection of 1850-1900 as a superior period against which to diagnose bona-fide human-driven warming.
In conclusion, our analysis shows here numerous months exceeding 1.5°C of global warming, including a latest breach, March 2023, occurring despite during natural conditions that act to cool greenhouse gas warming. This should serve as a stark and sobering indicator of our current position with respect to ‘safe’ climate warming levels.
A ‘by-the-book’ UN-FCCC breach, will be composed of a multi-year period in which some months exceed 1.5°C by some distance, others not so much, and some where the observed warming anomalies are <1.5°C.
The findings reported here are consistent with the first emergence of such a pattern.
Dr Craig Wallace is Lead Climatologist at EarthSystemData. He holds a PhD degree in physical climatology from the world-renowned Climatic Research Unit at the UK’s University of East Anglia (co-creators of the HadCRUT5 data set). He has 20 years experience of post-doctoral climate change research involving analysis of instrumental and modelled climate data and he is an IPCC-cited author.
References:
[1] Morice, C.P., Kennedy, J.J., Rayner, N.A., Winn, J.P., Hogan, E., Killick, R.E., Dunn, R.J.H., Osborn, T.J., Jones, P.D., and Simpson, I.R., 2021: An updated assessment of near-surface temperature change from 1850: the HadCRUT5 dataset. Journal of Geophysical Research 126, e2019JD032361, doi:10.1029/2019JD032361
[2] https://unfccc.int/files/essential_background/convention/application/pdf/english_paris_agreement.pdf
[3] IPCC, 2013: Climate Change 2013: The Physical Science Basis. Contribution of Working Group I to the Fifth Assessment Report of the Intergovernmental Panel on Climate Change [Stocker, T.F., D. Qin, G.-K. Plattner, M. Tignor, S.K. Allen, J. Boschung, A. Nauels, Y. Xia, V. Bex and P.M. Midgley (eds.)]. Cambridge University Press, Cambridge, United Kingdom and New York, NY, USA, 1535 pp.
[4] IPCC, 2021: Climate Change 2021: The Physical Science Basis. Contribution of Working Group I to the Sixth Assessment Report of the Intergovernmental Panel on Climate Change[Masson-Delmotte, V., P. Zhai, A. Pirani, S.L. Connors, C. Péan, S. Berger, N. Caud, Y. Chen, L. Goldfarb, M.I. Gomis, M. Huang, K. Leitzell, E. Lonnoy, J.B.R. Matthews, T.K. Maycock, T. Waterfield, O. Yelekçi, R. Yu, and B. Zhou (eds.)]. Cambridge University Press, Cambridge, United Kingdom and New York, NY, USA, In press, doi:10.1017/9781009157896.
[5] IPCC (2018). Global Warming of 1.5°C: IPCC Special Report on impacts of global warming of 1.5°C above pre-industrial levels in context of strengthening response to climate change, sustainable development, and efforts to eradicate poverty (1 ed.). Cambridge University Press. doi:10.1017/9781009157940.001. ISBN 978-1-009-15794-0.
[6] https://www.climate-lab-book.ac.uk/2017/defining-pre-industrial/
[7] Hawkins, E., and Coauthors, 2017: Estimating Changes in Global Temperature since the Preindustrial Period. Bull. Amer. Meteor. Soc., 98, 1841–1856, https://doi.org/10.1175/BAMS-D-16-0007.1.
[8] David I. Armstrong McKay et al. ,Exceeding 1.5°C global warming could trigger multiple climate tipping points.Science377,eabn7950(2022).DOI:10.1126/science.abn7950
[9] Lenton TM, Rockström J, Gaffney O et al. 2019. Climate tipping points – too risky to bet against. Nature 575: 592– 595.
[10] https://climate.copernicus.eu/tracking-breaches-150c-global-warming-threshold
[11] UN-FCC, 1992, FCCC/INFORMAL/84 GE.05-62220 (E) 200705
[12] pers. comm. Professor Tim Osborn, 2023
[13] GISTEMP Team, 2023: GISS Surface Temperature Analysis (GISTEMP), version 4. NASA Goddard Institute for Space Studies. Dataset accessed 20YY-MM-DD at https://data.giss.nasa.gov/gistemp/.
[14] Lenssen, N., G. Schmidt, J. Hansen, M. Menne, A. Persin, R. Ruedy, and D. Zyss, 2019: Improvements in the GISTEMP uncertainty model. J. Geophys. Res. Atmos., 124, no. 12, 6307-6326, doi:10.1029/2018JD029522.
[15] Gao, Chaochao, Alan Robock, and Caspar Ammann, 2008: Volcanic forcing of climate over the past 1500 years: An improved ice-core-based index for climate models. J. Geophys. Res., 113, D23111, doi:10.1029/2008JD010239.