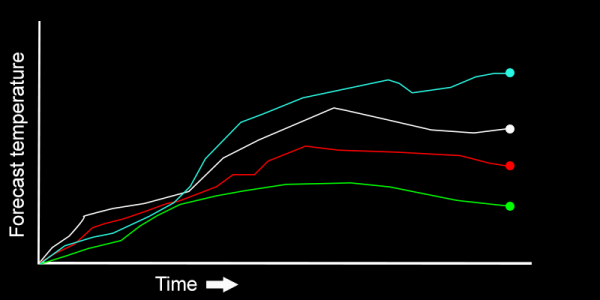
Forecasting weather, the climate or oceans is difficult for a host of reasons. Devising a set of equations that can describe how air and water circulate across the planet under different conditions (height, temperature, changing density etc) to name but one. But beyond that, even with a good set of equations, predictions are plagued by another problem: that very small differences in the starting numbers for the forecast equations – ‘initial conditions’ – lead to vastly-different end forecasts. How do we address this problem for end-users, especially for long-range forecasts?
The exact problem may be known to you already as the ‘Butterfly effect’ – the idea that the flapping of a butterfly’s wings can result in a particular sequence of chain reaction events leading to vastly different outcomes elsewhere. This illustration, in fact, was coined by the mathematician and meteorologist, Edward Lorenz, himself who was central to discovering the ‘starting condition problem’ together with researching its effects on how forecasts evolve through time and, ultimately, arrive at different predictions.

In the 1960s Lorenz created a simplified set of equations for an aspect of weather dynamics called ‘convection’ – describing how to simulate heat-driven rising and sinking of air masses. When applying his equations into weather forecasting computer code, Lorenz was at a loss to explain how two simulations using the same computer arrived at radically different weather forecasts.
All he had done, for the second forecast, was to stop the computer half way through its run, print out the weather conditions at that point, and then re-input the numbers later to re-start, and finish, the second forecast.
Unbeknown to Lorenz at the time, the printer used a slightly lower decimal precision for the numbers than used in the computer’s physical memory. In the first forecast (with no stopping involved) the whole forecast proceeded at high numerical precision. The second forecast, however, the numbers had very slightly changed precision half way through.
Lorenz was still perplexed: both sets of numbers were reasonably high precision, what difference could five, rather than six, decimal precision make to the same numbers? In fact, and as his subsequent research showed, a lot.

Lorenz had discovered the initial condition sensitivity of weather forecast equations, where even very small differences in the numbers, profoundly different forecasts emerged, and the differences grew bigger the farther into the future the forecasts ran. This characteristic behaviour for solutions of this type of equations was eventually written up and gave rise to new research fields within fluid dynamics: Lorenz systems, chaos theory, non-periodic flow, together with ideas about how this effect could be managed, especially given that we do not have perfect observations (starting conditions) for the whole planet, when launching a forecast.
What, then, are ‘ensembles’ and how/why are they used? A good analogy is to consider the meaning of the word in a musical sense – a collection of components (instruments) all contributing together to make a set. In our case, however, the ensemble is a collection of forecasts simulations, all identical but each with slightly varying starting conditions. An ensemble approach is needed for forecasting because our real-time weather observations, whilst good, are nowhere near perfect – in terms of geographical coverage and accuracy. To account for this, an ensemble of forecasts, can maximise as many runs as is computationally possible – to reflect our uncertainty of the observations. The end user is provided with a range of possible outcomes, that reflects how the forecasts vary in each ensemble member.

In part, this approach is why you hear phrases such as ‘10% chance’ of rainfall, or a ‘20% probability’ of a warmer than average summer: the numbers reflect how many of the ensemble members give rise to that particular weather condition. Long range forecasts are especially susceptible to initial condition sensitivity because, as Lorenz showed, the differences due to small differences in the starting conditions get very large the farther in time the simulations are run.
By averaging all ensemble members together and providing the user with ‘mean forecast conditions’ we can give users a general indication of forthcoming weather – up to a point. However, since all ensemble members are equally possible – a particular ensemble member that predicts a very very warm month might be as equally as likely as an ensemble member predicting average conditions, it is valuable to the user, if possible, to provide the full set of ensemble members.
This is especially important for organisations needing to plan for ‘worst’ or ‘best’ case scenarios. It may not be possible to say which forecast is likely, but stress-testing an organisation’s strategy against the worst and best case conditions can identify shortcomings, and ways to improve resilience. In facing adverse weather, this preparedness can prove extremely valuable – especially if the worst-case forecasts transpire.
Version 1.0 of ESD’s Seasonal Forecaster service currently provides water-industry specific ensemble-average data from five national numerical weather prediction systems. Our intention has been to expand this to provide full sets of ensemble data – each transformed into the area and time frame of interest to our users – and we are pleased to announce that development of this feature has now started. V2.0 will continue to give users bespoke, ensemble-average output for DWD, NCEP, UKMO and Meteo-France systems, but will offer ensemble products for the ECMWF system.
More soon as this feature is launched!
– Craig Wallace, EarthSystemData
More on ensemble modelling: https://www.ecmwf.int/en/elibrary/10729-ensemble-forecasting
Nice MIT video documenting Lorenz and colleague’s, Jule Charney’s, work: https://www.youtube.com/watch?v=MTwga6dch2s
EarthSystemData designs and deploys climate data solutions to meet organisational needs. We specialise in climate risk assessment, risk disclosure and adaptation projects assisting multi-national firms through to local clients. To discuss using our research or consultancy services contact us here: info[at]earthsystemdata.com

